
T-Test
 A t-test is one of the most frequently used procedures in statistics.
But even people who frequently use t-tests often don’t know exactly what happens when their data are wheeled away and operated upon behind the curtain using statistical software like Minitab.
It’s worth taking a quick peek behind that curtain.
Because if you know how a t-test works, you can understand what your results really mean. You can also better grasp why your study did (or didn’t) achieve “statistical significance.”
In fact, if you’ve ever tried to communicate with a distracted teenager, you already have experience with the basic principles behind a t-test.
Anatomy of a t-test
A t-test is commonly used to determine whether the mean of a population significantly differs from a specific value (called the hypothesized mean) or from the mean of another population.
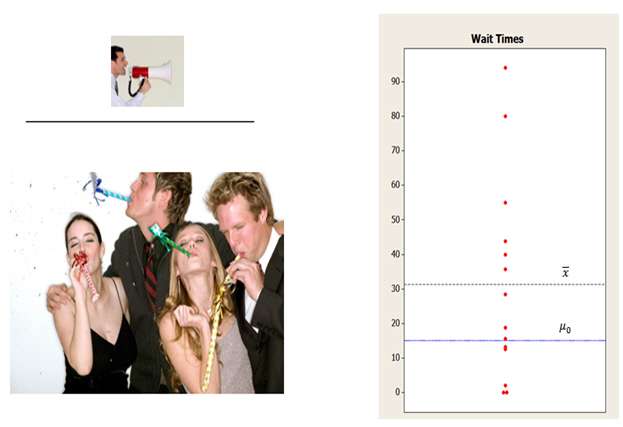
For example, a 1-sample t-test could test whether the mean waiting time for all patients in a medical clinic is greater than a target wait time of, say, 15 minutes, based on a random sample of patients.
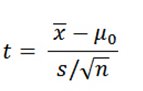
To determine whether the difference is statistically significant, the t-test calculates a t-value. (The p-value is obtained directly from this t-value.) To find the formula for the t-value, choose Help > Methods and Formulas in Minitab, then click Basic statistics > 1-sample t > Test statistic. Here's what you'll see:
That jumble of letters and symbols may look like an incantation from a sorcerer’s book.
But the formula is much less mystical if you remember there are two driving forces behind it: the numerator (top of the fraction) and the denominator (bottom of the fraction).
The Numerator Is the Signal
 The numerator in the 1-sample t-test formula measures the strength of the signal: the difference between the mean of your sample (xbar) and the hypothesized mean of the population (µ0).
Consider the patient waiting time example, with the hypothesized mean wait time of 15 minutes.
If the patients in your random sample had a mean wait time of 15.1 minutes, the signal is 15.1-15 = 0.1 minutes. The difference is relatively small, so the signal in the numerator is weak.
However, if patients in your random sample had a mean wait time of 68 minutes, the difference is much larger: 68 - 15 = 53 minutes. So the signal is stronger.
The Denominator is the Noise
The denominator in the 1-sample t-test formula measures the variation or “noise” in your sample data.
S is the standard deviation—which tells you how much your data bounce around. If one patient waits 50 minutes, another 12 minutes, another 0.5 minutes, another 175 minutes, and so on, that’s a lot of variation. Which means a higher s value—and more noise. If, on the other hand, one patient waits 14 minutes, another 16 minutes, another 12 minutes, that’s less variation, which means a lower value of s, and less noise.


You might also like


|
California POST Exam Secrets Study Guide: POST Exam Review for the California POST Entry-Level Law Enforcement Test Battery (PELLETB) (Mometrix Secrets Study Guides) Book (Mometrix Media LLC) |


 Test cricket is the longest form of the sport of cricket. Test matches are played between national representative teams with "Test status", as determined by the International Cricket Council (ICC), with four innings played between two teams of 11 players over a period of up to a maximum five days. It is generally considered the ultimate test of...


